Meteorology (Study of the Atmosphere)
Essay
Philadelphians have pursued significant scholarly and popular interests in meteorology, the scientific study of the atmosphere, since the eighteenth century. Pioneering individuals, including Benjamin Franklin (1706–90) and Reuben Haines (1786–1831), tracked meteorological data, and scientific societies made the practice increasingly systematic by the late nineteenth century. Short-term weather forecasting became possible as technological innovations such as the telegraph and, later, Doppler radar enabled speedy communication of meteorological information. By the twenty-first century, television viewers gained familiarity with the science through broadcast meteorology, a staple of local news programs.
A number of Philadelphia’s early meteorological discoveries resulted from the work of Benjamin Franklin, who became interested in tracking storms in the 1730s. In 1743, a lunar eclipse led Franklin to discover the nature of their movement. Franklin had hoped to observe the start of the eclipse from Philadelphia, but a storm with unusually strong northeasterly winds rolled in an hour prior and obscured his view. Later, Franklin learned that the eclipse had been visible in Massachusetts, where the storm arrived long after the eclipse started. Because the winds blew from the northeast, Franklin had assumed that the storm had traveled from Boston toward Philadelphia, but in fact it had traveled in the other direction. After researching storms with northeasterly winds, he discovered that storms begin to the leeward (the direction in which the winds are blowing) and move windward (against the wind). These and other scientific observations appeared on a 1749 map of the mid-Atlantic colonies published and drawn by Lewis Evans (c. 1700–56).
From Data to Forecasting
Throughout the eighteenth and nineteenth centuries, a pervasive culture of meteorological observation developed as Philadelphians recorded atmospheric and weather data in almanacs, diaries, and journals. These ranged from simple descriptions of whether it was sunny, cloudy, or rainy each day to sophisticated measurements of air pressure and temperature. During the 1820s, Reuben Haines, corresponding secretary of the Academy of Natural Sciences, maintained a meteorological register at Wyck House in Germantown. His data, which included mean temperatures, total snow and rain fall, wind directions, and barometric readings, was incorporated into other scientific studies, including medicine. Diseases had seasonal patterns that doctors sought to explain by marrying knowledge of epidemics to meteorological data. Physicians John K. Mitchell (1798–1858) and John Bell (1796–1872), writing to the North American Medical and Surgical Journal in 1826, used Haines’s data to assess regional and temporal differences in smallpox outbreaks that had occurred in 1823 and 1824.
Local scientific institutions soon began to understand the necessity of keeping detailed weather data. In 1837, the Pennsylvania legislature funded the Joint Committee on Meteorology of the American Philosophical Society and the Franklin Institute of Pennsylvania. This committee issued various reports in the Journal of the Franklin Institute in addition to instructions for taking meteorological data. This was no simple job; calculations had to be taken at set times each day, and data takers had to be sensitive to the contingencies of storms. At Delaware County Institute of Science in Media, Delaware County, Joseph Edwards (1796–1858) and Sarah L. Miller (1803–90) recorded weather data in the 1840s and 1850s. For several years, they spent a significant portion of their days compiling meteorological data. Such data was chiefly used to track long-term patterns. Meteorological data sets taken over the course of many years could be averaged to forecast weather for the coming year. By the mid- to late nineteenth century, as telegraphs allowed meteorological data to be shared more quickly, scientific societies increasingly used this information to generate short-term forecasts. Atmospheric phenomena could be tracked as they moved across the country; as a storm passed through particular outposts, for example, meteorologists could telegraph ahead to the next station in advance of the storm. New uses of meteorological data demanded a rigorous reassessment of standards; the Franklin Institute’s meteorological records after 1872 were so thorough that the National Weather Service later used this historical data in assessing climate change.
In addition to the use of telegraphs, meteorological technology in Philadelphia improved in other ways between the late nineteenth and early twenty-first centuries. A number of Philadelphia companies, such as McAllister & Brother, sold meteorological instruments for use at home, school, and in professional settings. Illustrated catalogues from the mid to late nineteenth century depicted finely made hygrometers, which measure moisture content; barometers, which measure atmospheric pressure; and rain gauges.
Doppler Radar and Storm-Tracking
One of the more significant technological advances in meteorology came about by accident during World War II: Doppler radar, which an experimental radar station in Lakehurst, New Jersey, used to detect the Great Atlantic Hurricane of 1944, felt along the mid-Atlantic coast. During the war, the United States used airplanes equipped with Doppler radar units to detect enemy ships, but realized that the radar was also picking up images of various weather events. Scientists adapted this technology to track weather systems; the Great Atlantic Hurricane was the first such storm in North America detected by a Doppler system. Pulse-Doppler, developed in the 1950s and 1960s further improved radio and television forecasting and was later complemented by satellite technology. Local news stations often referred to their systems in colorful ways—for example, WPVI-TV ABC 6’s “Stormtracker 6,” which in the era of smart phones, also became available as an app that allowed users to track storms in real time.
By the late twentieth century local broadcast forecasting relied on information from the National Weather Service, which, in the 1980s, developed an S-Band doppler system known as “NEXRAD” that was capable of more sophisticated Doppler velocity readings, among other advantages. NEXRAD was rolled out to the region in 1993, but the Philadelphia station was moved to Westampton near Mount Holly (designated as Philadelphia/Mount Holly). For hurricane data, local broadcast journalists used data from the National Hurricane Center.
Collaboration between local broadcasters and national meteorological institutions combined with improved technology gave the region more advance warning of impending major weather events. For example, in 2012 during Hurricane Sandy, the largest recorded Atlantic hurricane and the deadliest of that season, Philadelphia’s broadcast meteorologists issued safety information before and during the event. ABC 6’s Cecily Tynan (b. 1969) and NBC 10’s Glenn “Hurricane” Schwartz (b. 1951), a former hurricane chaser for the Weather Channel and graduate of Penn State’s prestigious meteorology program, provided copious scientific context. While the severity of the Sandy event brought nationwide attention to meteorologists in the Philadelphia region, Tynan, Schwartz, and their associates brought the same scientific analysis to more common weather events, including snowstorms. Seeking to engender the same scholarly enthusiasm that he brought to his own show, in 2005 Glenn Schwartz founded Hurricane’s Outreach Program to Educate Scientists (HOPES), an academic program to increase minority participation in the fields of meteorology and earth science.
By the twenty-first century, the discipline of meteorology had dramatically changed. Eighteenth-century people could only make long-term predictions by averaging or manipulating data sets. The efforts of individuals and scientific societies in the nineteenth century improved the discipline by keeping extensive data and developing rigorous standards. Modernizing technology, from the telegraph to Doppler radar systems, introduced first the possibility and later the efficiency of short-term forecasts. Twenty-first-century Philadelphians benefited from meteorological communications ranging from CBS KYW’s News Radio to Philly.com’s NBC10 First Alert Weather widget to receive current and urgent atmospheric data.
Jessica Linker is a doctoral candidate at the University of Connecticut, Storrs, and the recipient of fellowships from a number of Philadelphia-area institutions, including the Library Company of Philadelphia, the American Philosophical Society, and the McNeil Center for Early American Studies. Her work focuses on American women and scientific practice between 1720 and 1860. (Author information current at time of publication.)
Copyright 2016, Rutgers University
Gallery

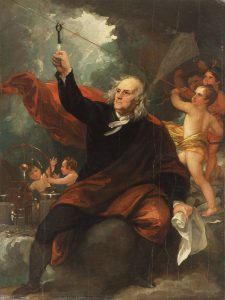
Benjamin Franklin's Kite Experiment
Benjamin Franklin sought to prove that lightning was atmospheric electricity around the same time he became interested in tracking storms. In 1749, he invented lightning rods to protect Philadelphia households from lightning strikes. He also hoped to use lightning rods to charge Leyden jars. French scientist Thomas-Francois Dalibard successfully performed this experiment in May 1752 after translating Franklin’s pamphlet on the subject. In June of the same year, Franklin executed the experiment but replaced the lightning rods with a kite; the strings picked up ambient charges during the storm and charged the Leyden jar, corroborating his theory about the nature of lightning. Franklin's experiments with electricity were depicted in Benjamin West's c. 1816 painting Benjamin Franklin Drawing Electricity from the Sky.
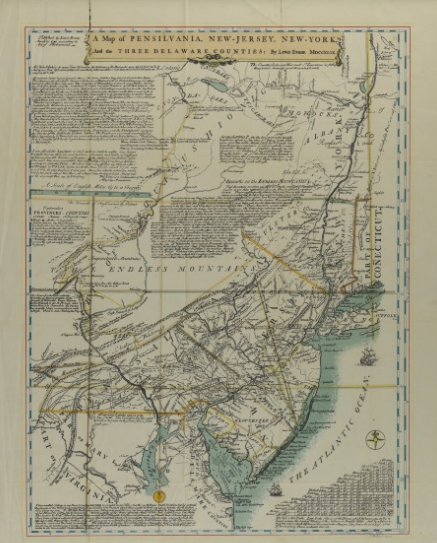
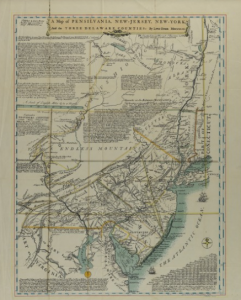
Lewis Evans Map
Historical Society of Pennsylvania
A 1743 lunar eclipse obscured by a storm was the basis for one of the Philadelphia area's earliest meteorological discoveries. Benjamin Franklin hoped to view the eclipse, but a storm blocked his view. The eclipse was visible in Massachusetts, however, which led Franklin to conclude that the storm traveled from the southwest to the northeast rather than the northeast to the southwest, as was assumed. These observations were included on Lewis Evans 1749 map of the region, shown here. The relevant text reads, All our great storms begin Leeward: thus a NE storm shall be a Day sooner in Virginia than Boston.
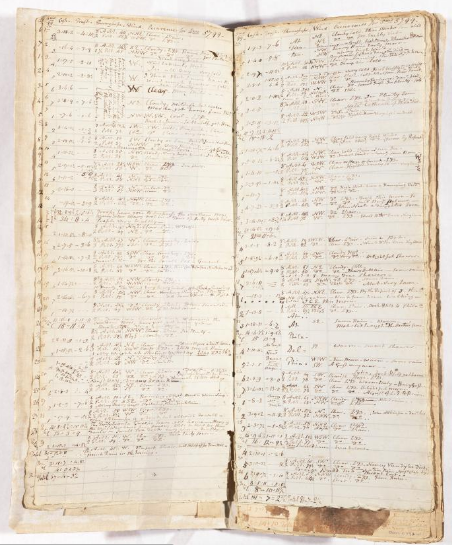
Weather Diary of John Craft
Historical Society of Pennsylvania
The recordings of ordinary citizens were helpful in tracking weather patterns in the early days of meteorology. This diary was kept by John Craft of Burlington, New Jersey, which lies on the Delaware River northeast of Philadelphia. In addition to wind direction, cloud cover, and temperature, Craft noted the behavior of birds as an indicator of the weather. He kept this journal from 1796 until 1800.
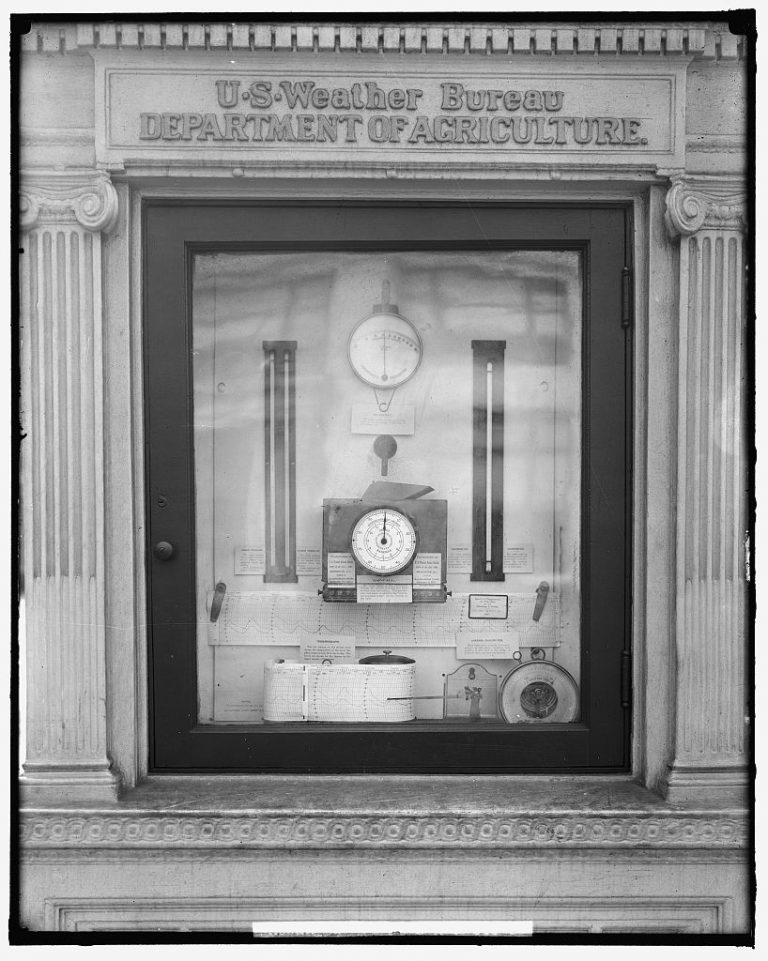
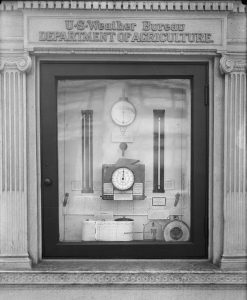
Weather Instruments
Prior to the invention of Doppler radar and other modern weather tracking equipment, meteorologists relied on analogue tools such as these to record and forecast the weather. They included barometers for measuring air pressure and a hygrometer for measuring humidity. Used in combination, these tools could help predict a coming storm based on current conditions, and some of these devices remain in use today.
During World War II, Doppler radar– developed to track enemy aircraft during night combat–was found to also pick up storm systems. It was first used for this purpose at the Lakehurst, New Jersey, weather station to record the Great Hurricane of 1944.

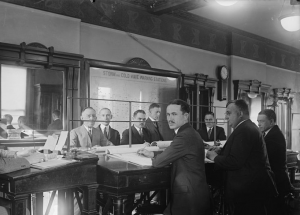
Hand-Drawn Weather Map
Weather maps help meteorologists determine and forecast weather events. They can include such data as temperature, wind speed, and air pressure to allow meteorologists to locate incoming weather fronts and storms. Historically, these maps had to be drawn by hand by skilled artists and were used to predict the path of major weather events. They became especially important with the advent of aviation. This 1924 photograph shows a group of meteorologists from the National Weather Bureau hand-drawing a weather map. In the twenty-first century, weather maps are computer generated, using data from regional weather stations.
Backgrounders
Connecting Headlines with History
- In the wake of Hurricane Sandy, a Delaware geography professor analyzes the storm (WHYY, November 1, 2012)
- Shooting the breeze with Delaware's 'wind lady' (WHYY, December 31, 2013)
- The science of forecasting wintry weather (WHYY, March 7, 2014)
- Student meteorologist tackles challenge of predicting Philadelphia’s ozone pollution (WHYY, March 31, 2015)
Links
- Weather Instruments (Franklin Institute)
- Historical Weather Data for Philadelphia (Franklin Institute)
- National Weather Service Forecast Office for Philadelphia and New Jersey (National Weather Service)
- Benjamin West, "Franklin Drawing Electricity from the Sky" (Philadelphia Museum of Art via YouTube)